On Nov. 6, 2018, more than 2 million Arizonans flocked to polling places around the state to vote. All of Arizona’s executive offices were on the ballot. So were all of Arizona’s nine seats in the U.S. House and one seat in the U.S. Senate.
By the time the night was over, Arizonans had elected five Democrats to the U.S. House, marking just the third time since 1994 that voters elected a majority of Democrats for the state’s cache of House of Representatives. Democrats also picked up the Secretary of State and Superintendent of Public Instruction spots, with Katie Hobbs and Kathy Hoffman becoming the first Democrats to hold those roles since 1995. Sandra Kennedy won back a spot on the Arizona Corporation Commission after losing back in 2012.
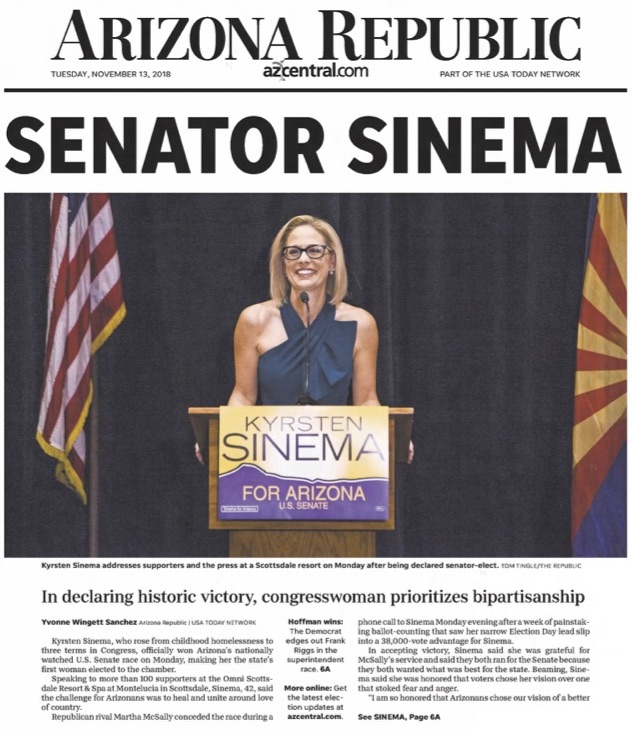
The most historic vote of the night, picking Arizona’s first female senator, wasn’t settled until six days later. The night of the election, Republican Martha McSally held a narrow lead over Democrat Krysten Sinema. But about a million early ballots were yet to be counted.
The nation was riveted by the slow-moving count until the Associated Press called the race in favor of Sinema on Nov. 12. Arizonans had elected their first Democrat to the Senate since 1985, when Dennis DeConcini won his third and final term, a seat he would hold through 1988.
That election, as well as the 2016 presidential election, is considered to be a preview of what is likely to expect in Arizona over the next decade − tightly contested races that could be decided by a handful of voters.
“If people think that 2016 was a hell of an election, they’re going to get surprised next year,” said attorney Bruce Adelson, who is the voting rights expert for the Arizona Independent Redistricting Commission. “Next year has the potential to be the most contentious American presidential and congressional election in modern memory.”
This project aimed to look ahead to what exactly those elections could look like by taking into account recent history, as well as the projected addition of a 10th congressional district. More specifically, it aimed to look ahead to what that means for the shift in political power moving forward, in terms of the number of congresspeople.
Elements of that analysis had been completed before. The New York Times found that if you continue to add congressional seats in Arizona after expanding the 435 currently allotted through appointment, it would likely eliminate safe Democrat districts, but would strengthen safe Republican districts. FiveThirtyEight evaluated how often they’d expect each party to win the congressional seats based on different types of maps, including some that were gerrymandered for each party. They found that the likelihood of having more safe Republican districts was higher, regardless of how competitively you drew the districts. Both analyses used 2012 and 2016 election data.
This project is different in that it combined elements of both previous analyses, using the most-recent election data.
Methodology
The projections of the maps were completed in multiple parts, using a pair of open-source programs that allow users to either draw their own maps, or generate fair maps. The first tool, called Autoredistrict and developed by Kevin Baas, uses electoral and racial demographics to generate proportionally optimized congressional maps. The second tool, called DRA 2020 and developed by Dave Bradlee, allows users to draw their own maps from scratch. Both programs rely on outside organizations for datasets.
The first part of the project was completed on Autoredistrict. Fair maps were first generated for an Arizona with 10 congressional districts that were proportionally optimized based on equal size, population, demographics, among other factors. The probability of party was then evaluated using 2012 election data, 2016 election data and 2018 election data. The process was then repeated for a swayed maps − first in favor of Democrats, then in favor of Republicans. The program also outputted district outcome probability curves, which show the likelihood of any district leaning toward a particular political party. The gerrymandered maps were completed with substantial help from Baas, the developer, who tweaked portions of the app to make an unfair map possible.
The second part of the analysis was completed on DRA2020. A map was hand-drawn using the criteria constitutionally required by the Arizona Independent Redistricting Commission. It was also completed with advice from Colleen Coyle Mathis, former head of the commission, who detailed the steps the commission took during their round of redistricting earlier this decade.
There are a few limitations to this research. Autoredistrict is programmed to generate maps that are equal in population, contiguous, compact, competitive and proportional, among other factors, but it is not state-specific, meaning it does not completely adhere to Arizona’s constitutional requirements, and, specifically, its human elements. Another issue is uncontested elections, which can’t be ignored and can’t be replaced with a “100%” victory for the winner. That required imputation of data, where results from another election were used to line up with the uncontested elections. DRA2020 also has similar analyses based on several similar measures, but also does not have state-specific requirements. Both programs rely on outside sources to generate shape files with population and demographic data, which in this case were provided by Harvard Dataverse.
‘Packing’ or ‘Cracking’
There are four types of gerrymandering, but perhaps the two which occur most frequently are “packing” and “cracking.”
Cracking occurs when communities are split into multiple districts so that one location does not all vote for a single candidate. Historically, it’s been used to dilute representation of minorities. While it’s been banned by the Voting Rights Act, it still persists, and was prevalent this decade when the state legislature in Texas split Austin, a predominantly liberal city, into multiple districts.
Packing occurs when politicians lump opposing voters into one district, which prevents those voters from swaying the results in favorable districts. Voters in the packed districts lose out because they can only support one representative. The practice was recently used in Florida, in the Orlando, Gainesville, and Jacksonville area, where African-American neighborhoods were grouped in with swamp land to create one district. The result was African-American representation in congress in historical numbers. That coincided with the suburbs surrounding those neighborhoods trending toward being more Republican.
The third type of gerrymandering is “hijacking.” It’s when party lines are drawn purposely to include two incumbents, effectively ensuring that one of them would lose. The fourth type is “kidnapping,” which is when a map is drawn to separate a politician’s hometown from their political base, which makes re-election harder.
Keeping it Fair
2012 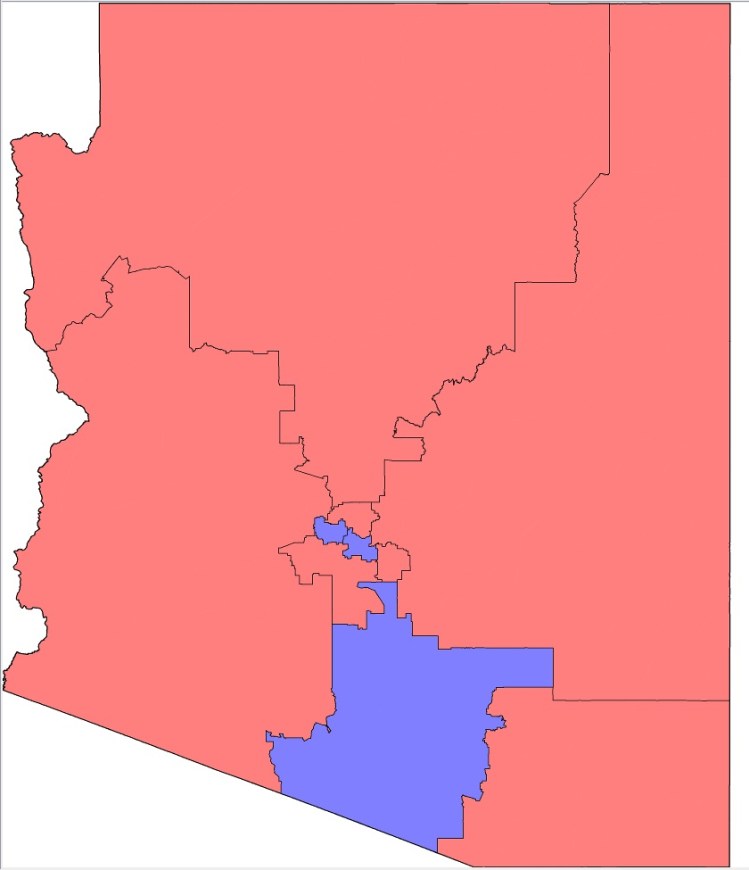
2016 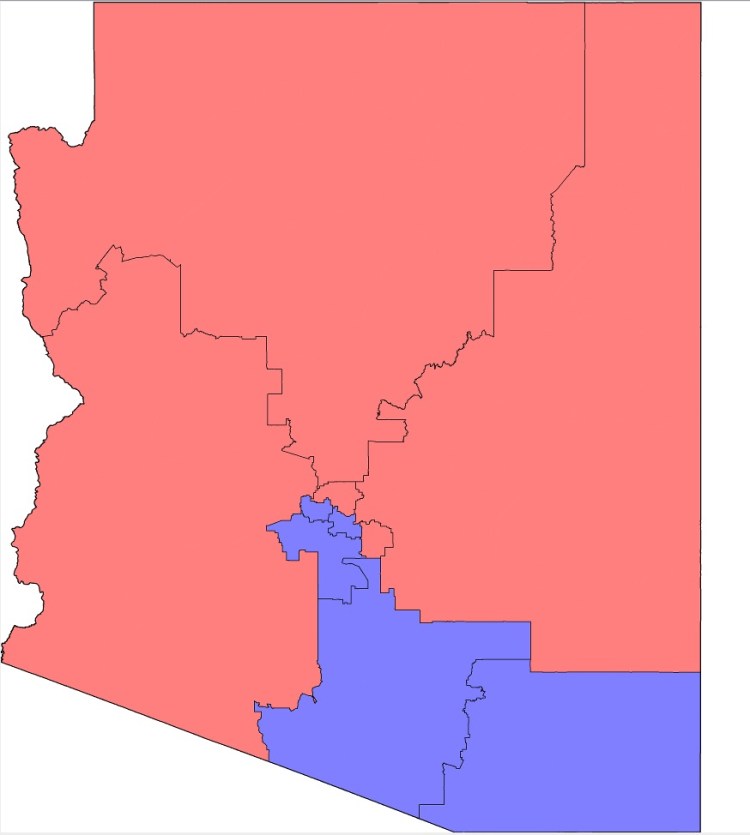
2018
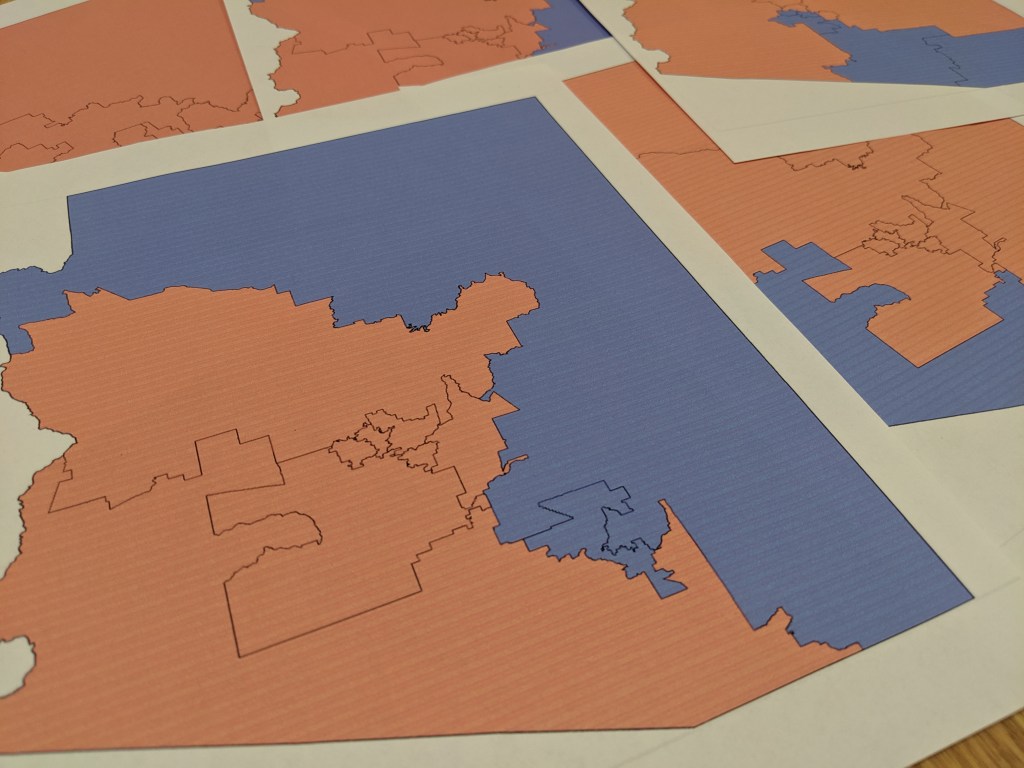
The proportionally optimized maps output an additional district outside of Phoenix’s metro area, Arizona’s most-populous metro area. In this case, Districts 1, 2, 3 and 4, the four largest current districts, were split to create an additional district in Southern Arizona.
The likelihood of the districts being either Democrat or Republican swayed blue over the course of the decade. While there were only three Democrat-leaning districts in 2012, that grew to a split map based on 2018 election results.
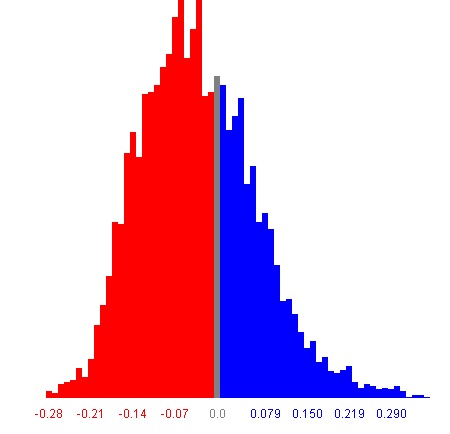
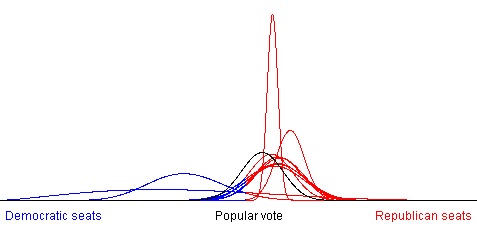
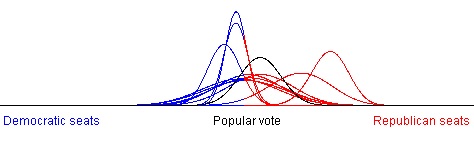
A glance at a district outcome probability curve (at left) shows that most districts in most elections lean slightly Republican based on a simulation of 100,000 elections. But the likelihood of an extreme gerrymander is about the same for both parties.
Republican Gerrymander

2012 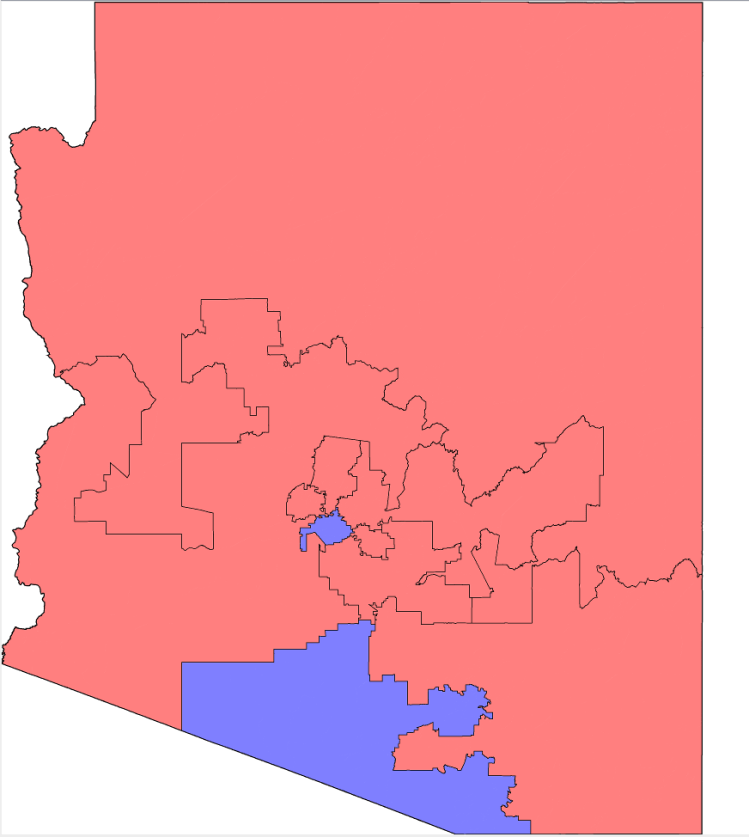
2016 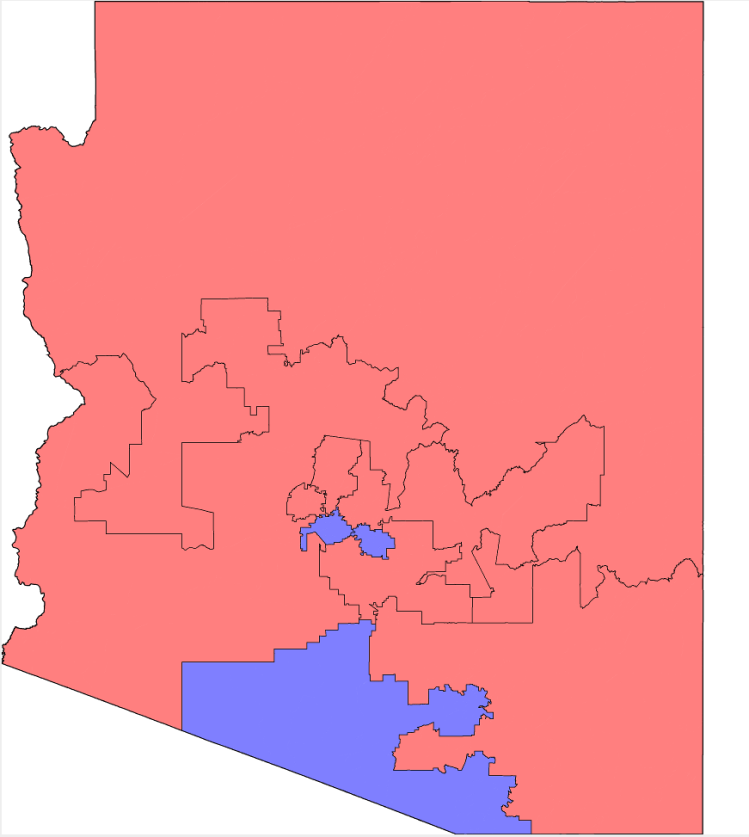
2018
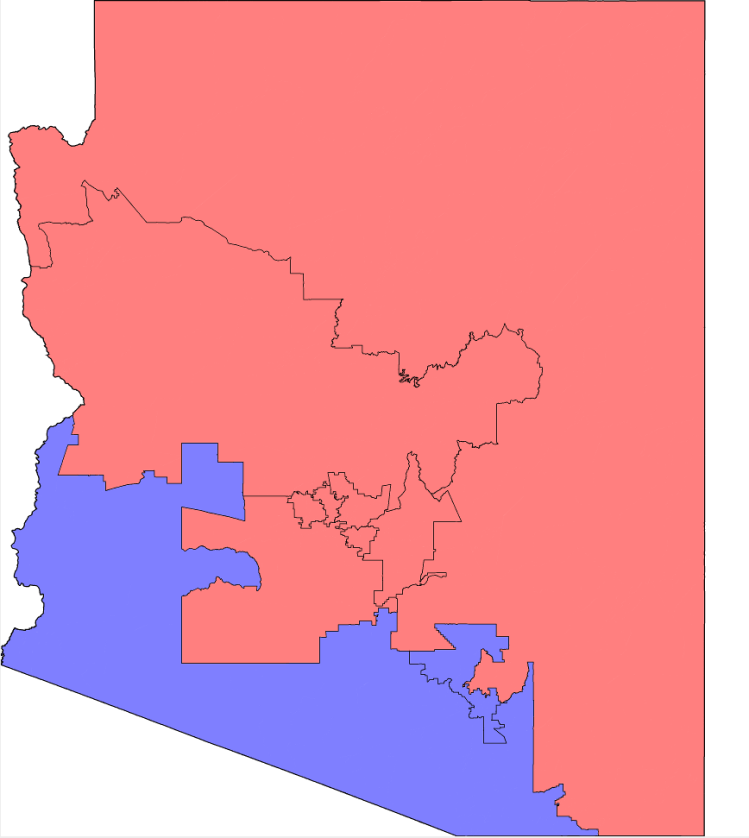
The Republican-leaning map shows that districts are more jagged and less contiguous, and tended to stay away from city centers. That’s especially true with one major exception: Tucson.
The likelihood of the districts being Republican decreased over time. But based on 2018 election results, the likelihood of the number of districts voting Democrat was just three.
The district vote outcome probability curve (below) shows that almost all of the Republican-leaning districts are toward the center, while all the Democrat-leaning districts are far to the left. The former is known as cracking, while the latter is known as packing. Cracking the excess Republican voters into surrounding districts increases the number of seats they can swing, while packing Democrat voters into non-competitive districts cuts off their ability to win seats.
Democrat Gerrymander
2012 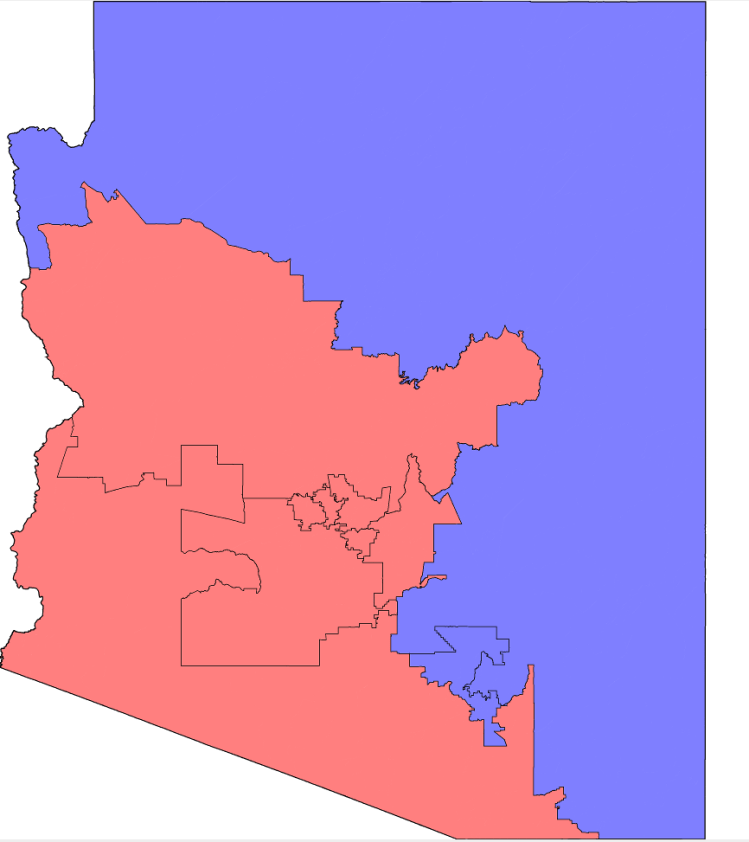
2016 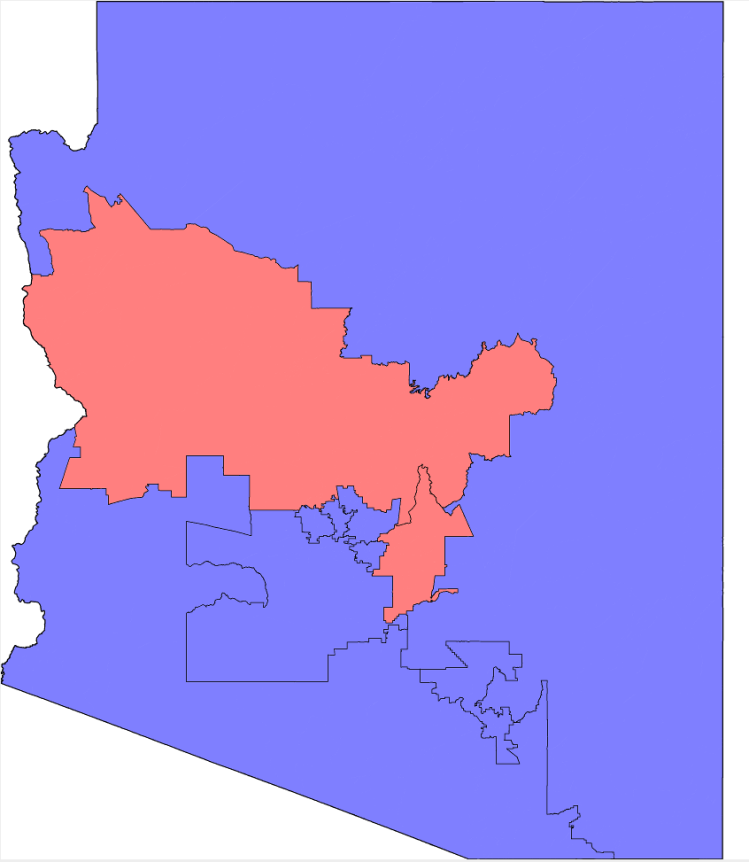
2018
The democrat-leaning map mostly kept intact Arizona’s largest district, District 1, which spans the majority of the eastern wing of the state, as well as District 3, which spans the southwest corner.
The likelihood of the districts being Democrat increased as the decade went on, with there being a likelihood that eight districts would vote blue based on the 2018 results, compared to just two based on the 2016 election results.
The district vote outcome probability curve (below) shows the blue curves not as close to the center, signifying almost the complete opposite of the maps that were swung the other way. That’s because Democrats are more likely to centralize themselves in largely populated areas, making it more difficult to draw districts for them that are competitive.
Following the commission’s lead
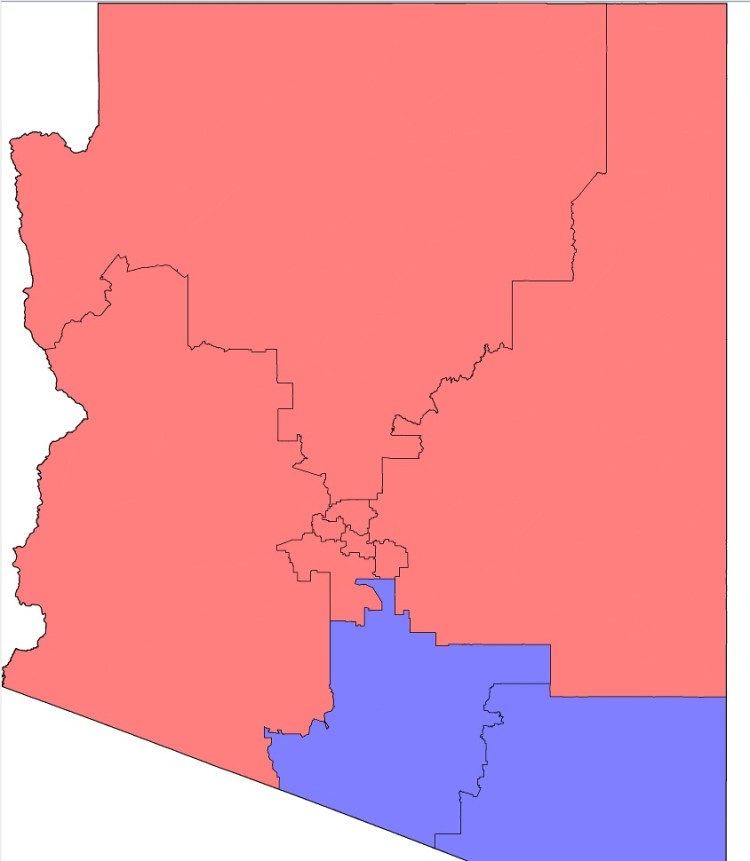
The hand-drawn map was made with the assistance of Mathis’ recollection of the commission’s process for drawing their maps. They started with a grid map, and then solicited public input from around the state to adhere to certain constitutional requirements regarding redistricting. The commission ultimately ended up with two districts that respected “communities of interest” and weighed the other factors, including equal population, compactness, city county and town boundaries, and competitiveness.
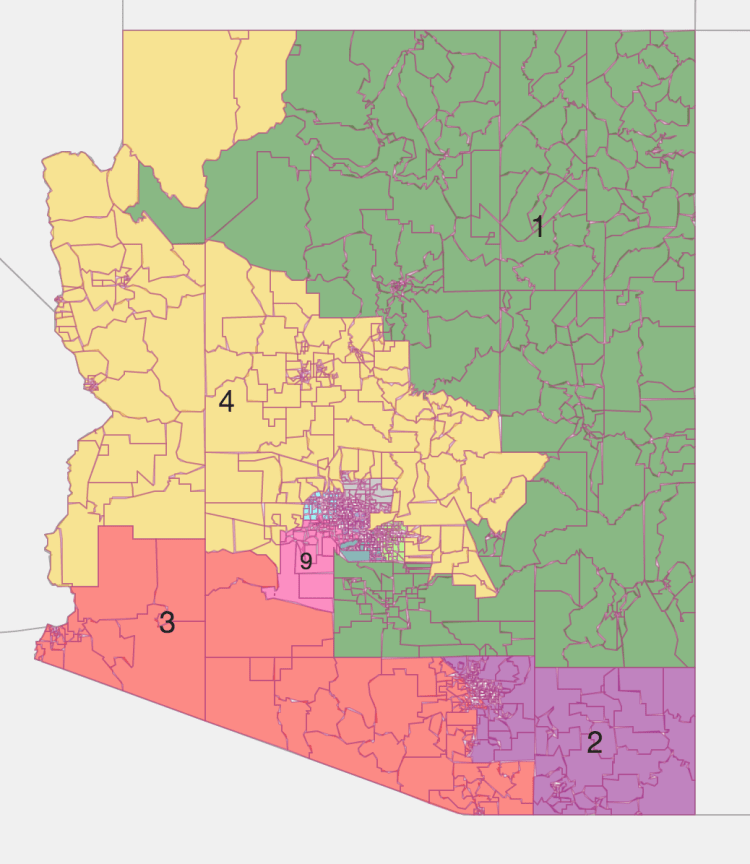
This project followed the same order. The two communities of interest were kept intact, which in turn ultimately kept intact the same district boundaries for Districts 1, 2, 3 and 4. Using a suggestion from Norrander, the UArizona professor, that the new districts are typically added where population increased the most, this project added a district in the Phoenix metro, and more specifically, in the eastern portion of the city.
The end result was a map that adhered to the requirements of compactness, cohesiveness, equal population to the extent practicable, respecting communities of interest, and respecting boundaries. The application rated as having an average compactness of 65 on a scale of 1-to-100, and produced four minority-majority districts in terms of race (although two were communities of interest). The largest deviation in population was 9.78 percent of the target, less than the 10 percent threshold.
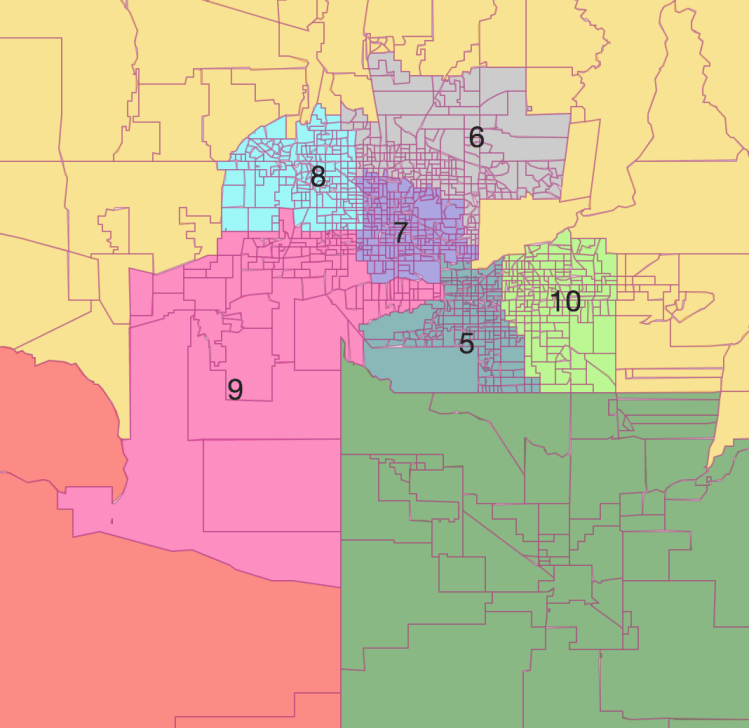
What the map didn’t do was adhere to the requirements of competitiveness, as only one district was rated “fair,” while five were swayed toward democrats and four toward Republicans. Further tweaks to the map increased competitiveness, but sacrificed the other factors, namely congruity.
Conclusion
The biggest takeaway from the research is that redistricting based on all the requirements set forth in the Arizona constitution is a complete balancing act, and that in order to adhere to all the requirements, some sacrifices have to be made.
Perhaps the most obvious sacrifice is competitiveness. Based on population and community of interest requirements, some districts have to span large portions of the state, which tend to be more rural. Since Democrats tend to cluster in bigger metro areas and Arizona only has two metro areas with a population above 200,000 people, some districts will remain Republican strongholds regardless of the way you draw them.
The second hardest issue to adhere to is respecting city boundaries. With so much of the population clustered in the Tucson and Phoenix metro areas, it’s very difficult to draw a map that doesn’t split the metro areas and counties. Keeping them together would likely result in a district that is Democrat leaning. In the Phoenix metro, the demographics of the west and east valley and central portions of the metro are very demographically different. It is possible to draw the districts competitively but that would likely come with a sacrifice of keeping cities and towns together.
The project ultimately showed that it is much easier to draw a Republican-leaning map than a Democrat-leaning map. While the state has become more competitive over the last decade, the likelihood of any individual district being Republican compared to Democrat is still slightly higher. Attempts to discuss the maps with congressional representatives in competitive districts were unsuccessful.
As for what may happen during the next round of redistricting, it’s too hard to predict because of the human elements of the process of drawing maps. Taking into account the research, which found that the 10th district is slightly likelier to be Republican, the state has effectively limited gerrymandering, and that the state is trending more Democrat, I think it would not be a surprise if the districts are split evenly during the next round of redistricting and subsequent elections.
